The news of Amazon’s next-day delivery took 2019 by storm. What followed was a flurry of successive similar announcements by other retail giants. E-commerce business owners and retailers are still reeling under the pressure of new delivery standards that have come to be termed as the “Amazon effect.”
At this juncture, it would be interesting to find out how equipped global shipping carriers (namely FedEx and UPS) are, if you decide to up your final-mile logistics strategy.
Before embarking on this exercise, it is important to take into consideration the shipping expenditure. For unlike Amazon or Walmart, which have access to a bottomless money pit, your company’s resources are likely to be limited.
There appears to be a correlation between the new FedEx and UPS shipping rates and package delivery performances of the two carriers across different industries and service types. This in turn will:
- Help you quantify the metrics that assess the performance of shipping carriers
- Draw inferences about intangible factors such as customer satisfaction, retention, and brand value
It is common knowledge that the new charges incorporated by UPS and FedEx have resulted in a 4.9% increase in the overall shipping costs. Of course, this is the average increase in costs across the industry. But if we dig deeper, the rate increase varies depending on individual shipping profiles.
For example, a leading apparel retailer in the US reported an appalling 40% increase in shipping costs after the general rate increase. Interestingly, the quality of the service offered (by both FedEx and UPS) barely leveled up to the higher shipping rates these companies were burdened with.
Shipping Next-Day?
Let’s look at the shipping rate increase for FedEx and UPS Next-Day delivery options:
| FedEx | |
| Service type | The average increase in shipping rate across zones |
| FedEx Priority Overnight | 5.80% |
| FedEx Standard Overnight | 5.40% |
| UPS | |
| Service type | The average increase in shipping rate across zones |
| UPS Next Day Air | 5.70% |
| UPS Next Day Saver | 5.20% |
As observed, with 2019 shipping charges in place, the actual rate increase is greater than the average 4.9% increase for expedited service types. Now let’s take a look at the delivery performance of these service types from Jan 2019 to May 2019.
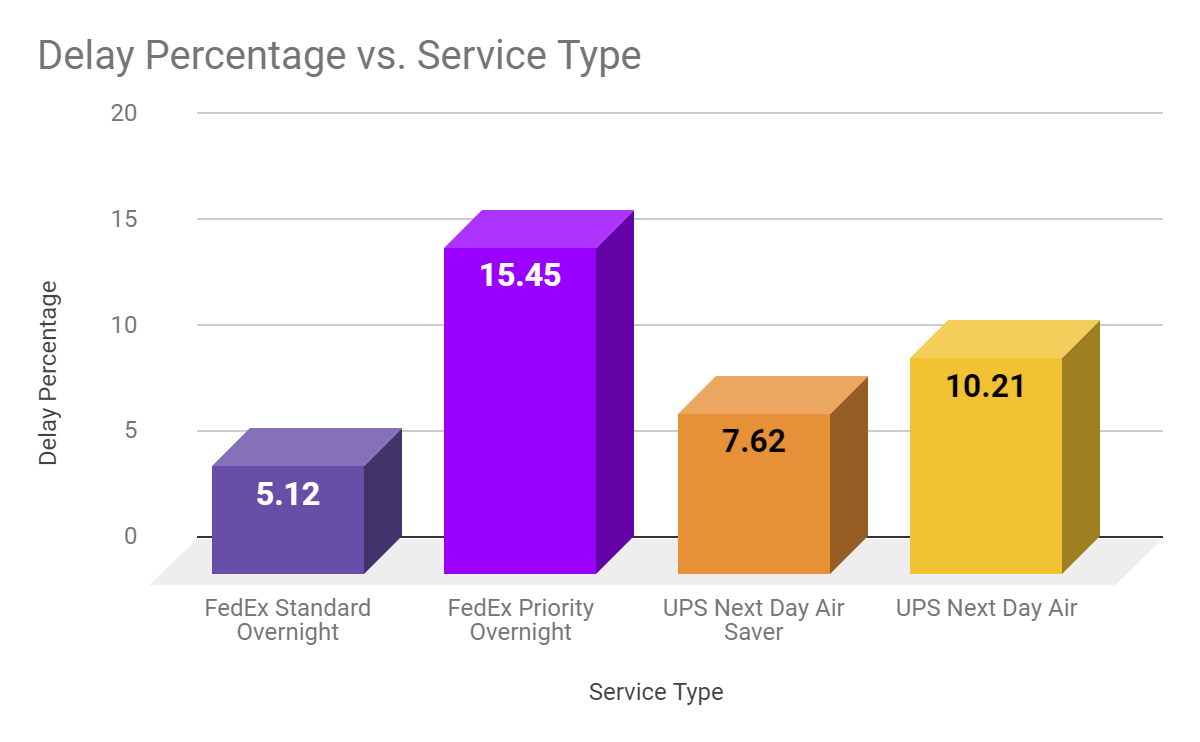
While the delivery performance of FedEx standard overnight is reasonable, the performance of FedEx Priority overnight is abysmal. As for UPS, both the expedited service types average around a nine percent delivery delay percentage.
Compared to last year’s delivery performance, there has been no significant improvement in the delivery performances of these expedited service types when compared to last year. So in effect, there has been no positive impact on the delivery performances resulting from higher shipping rates in 2019.
Comparing Apples to Apples
Ceteris paribus, you are spending an average of 4.9% more on shipments in 2019. Is the increase in the expenditure justified? How can you even be sure when factors like shipping volume, dimensional weight pricing, and zone pricing influence your overall shipping expense?
In order to analyze the cost vs performance trade-off, let us consider three popular e-commerce industries: apparel, electronics, and food.
For the expedited service types of FedEx and UPS, shipments across all three industries see a 5.4% increase in shipping costs compared to last year.
The increase in the rate of delivery delays for priority services of both FedEx and UPS in 2019 are represented here:
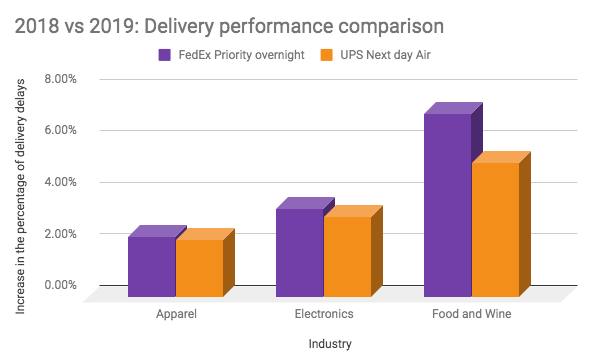
As is observed, the rate of delivery delays is three to four percent higher compared to last year for priority services of both FedEx and UPS. The ramification of a marginal spike in the delayed deliveries coupled with higher shipping spend is huge. Leave alone the measurable loss to your bottom line. The implication for your post-purchase customer experience is far-reaching. (Think a significant drop in the number of return shoppers).
So what are the steps that can be adopted to mitigate both tangible and intangible losses in the future?
Here are a few actionable strategies that can steer your business towards a profitable remainder of 2019 and beyond.
Retain Your Right to Shipping Refunds
It is that time of the year when shipping contracts are renewed. A few companies that we consult reported to have waived their money-back guarantee for delayed deliveries in return for a heftier discount.
This means companies pay a premium price for an inferior quality of service which they have no way of keeping in check. What companies don't realize is that they settle for a lesser discount in exchange for a money back waiver.
We delved deep into analyzing how much companies save/lose with and without the money-back guarantee.
Consider 2 apparel companies with similar volume and belonging to the same shipping zones.
Without waiver (when the business is eligible for refunds):
Average shipping cost: $6.38 - 6.88 (USD)
With waiver (when the business is not eligible for refunds)
Average shipping cost: $6.18 - 6.38 (USD)
As is observed, a 10% refund recovery rate will easily offset the negotiated discount rate which businesses win by repealing their right to dispute service failures.
It is imperative for businesses to calculate the opportunity costs before signing away their right to hold their carrier’s performance accountable. Performing an A/B test for shipping charges that are likely to be incurred in both the scenarios will help you pick the best course of action.
More Data for Better Negotiation
When it comes to negotiating shipping rates, businesses are usually wary. The reason is that shipping carriers lock in on a shipping rate, hammering their way through the process with a massive volume of well-researched data.
What if the scales can be tipped in your favor? Gaining access to the shipping rate benchmark for your industry can help you set a reasonable target price range. It is no secret that more information equals more negotiating prowess. Businesses must perform a comprehensive analysis of historical data, taking into account key metrics before entering into a contractual agreement with their shipping partners.
An Iterative Approach to Measuring Cost-Effectiveness
As a business owner or a logistics manager, do you measure the following points? And, more importantly, how often do you measure these metrics?
- Is the service level agreement being met?
- What is the variance in the fuel surcharge rates that are applied?
- Is the Dim weight calculated and billed accurately for every package that is shipped out?
- Do you have a mechanism to monitor delivery performance of your carrier?
- How are you ensuring that you are not overpaying your carrier?
It does not suffice to drown in this data once a quarter or once a month. Relevant data needs to be captured systematically and metrics have to be monitored continuously.
Ana Shan is a product evangelist at AuditShipment.com, an AI-driven audit service that automatically captures more than 20 carrier errors and helps businesses save up to 16% of their shipping costs. Visit https://auditshipment.com/ for more details. All information and statistics stated in the article are based on the information that has been collected across 150 shipping data points by AuditShipment’s proprietary algorithm.