In April, FedEx and UPS reinstated Money Back Guarantees (MBG) for on-time delivery on various express services, mainly Next Day Air and International Express packages. Generally, this was seen as a very positive sign that COVID’s impact on expected time-in-transit was decreasing. However, to date, neither carrier has reinstated MBG for the more widely-used Ground and 2-3 Day Air networks.
We can speculate on the reason(s) for the selective reinstatement of guarantees. Is it due to a legitimate inability to deliver in published time frames, or is the decision driven by a more profit-centered motive, utilizing a crisis as cover? In either case, it is a safe bet that when either carrier reinstates MBG for Ground services, the other will follow suit within hours. (The over/under is five hours – I have the under…)
In the meantime, every day, our clients are asking which carrier is better in terms of actual time-in-transit. Both carriers are making the case in contract RFPs that they are faster than the other. Having accurate time-in-transit projections is vital to e-comm shippers to set delivery expectations for clients.
In my past life as a logistics manager, we used the actual time-in-transit performance data as determined by the scanned ship date in conjunction with the delivery date provided by the carriers. From our data ,we would calculate statistical measures of performance to determine our confidence in the carriers’ published time-in-transit. Depending on recent actual performance, we would adjust our own promises of delivery displayed in cart. In general, both carriers would have rotating confidence level issues from time to time.
In my current role as a consultant, I have access to delivery performance data for hundreds of shippers. We compared actual carrier performance to current published time-in-transit information. In theory, the adverse impacts of COVID on carrier networks should be on the decrease. To start, let’s look at a comparative example of what the carriers are publishing relative to time-in-transit.
The maps below (Charts 1 & 2) show published time-in-transit comparisons between UPS and FedEx for the same origin ZIP Code out of Ohio. I chose Ohio due to its geographic desirability and high concentration of DCs and 3PLs. Ohio in most cases can reach the entire East Coast via the Ground networks in two days or less. I also set the ship day to be a Monday. In most cases, items shipping on a Monday have a published transit time of four days to Zone 8 - the longest contiguous US zone. This would mean an expected Friday delivery to Zone 8 via the UPS Ground Residential and FedEx Home Delivery networks.
UPS Ground Residential Expected Time-in-Transit: (Chart 1)
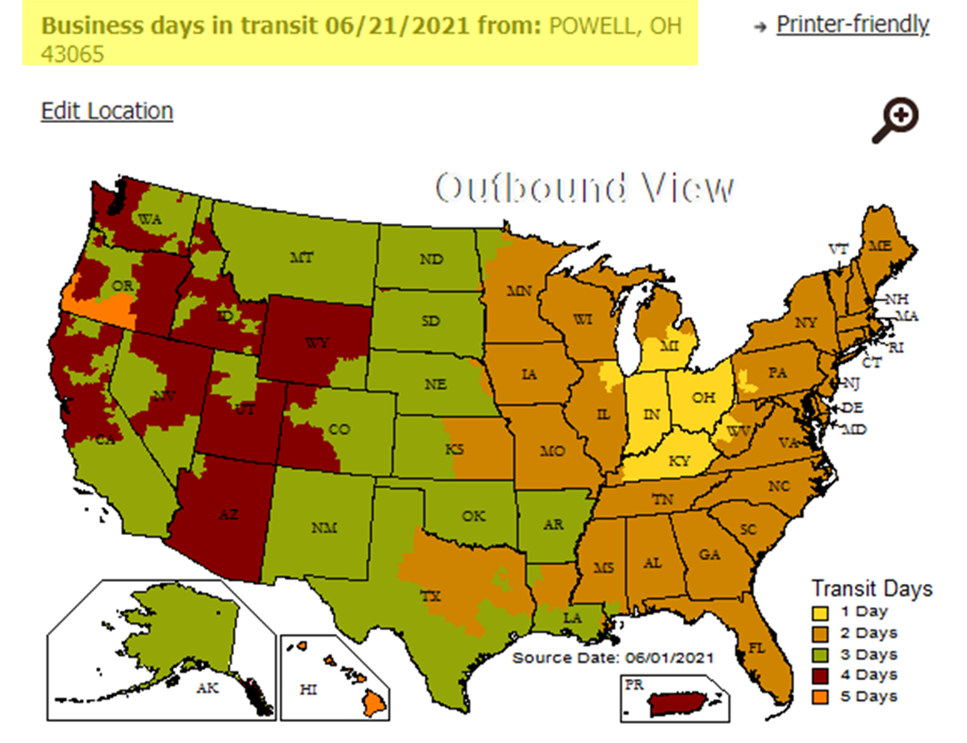
FedEx Ground Residential Expected Time-in-Transit: (Chart 2)
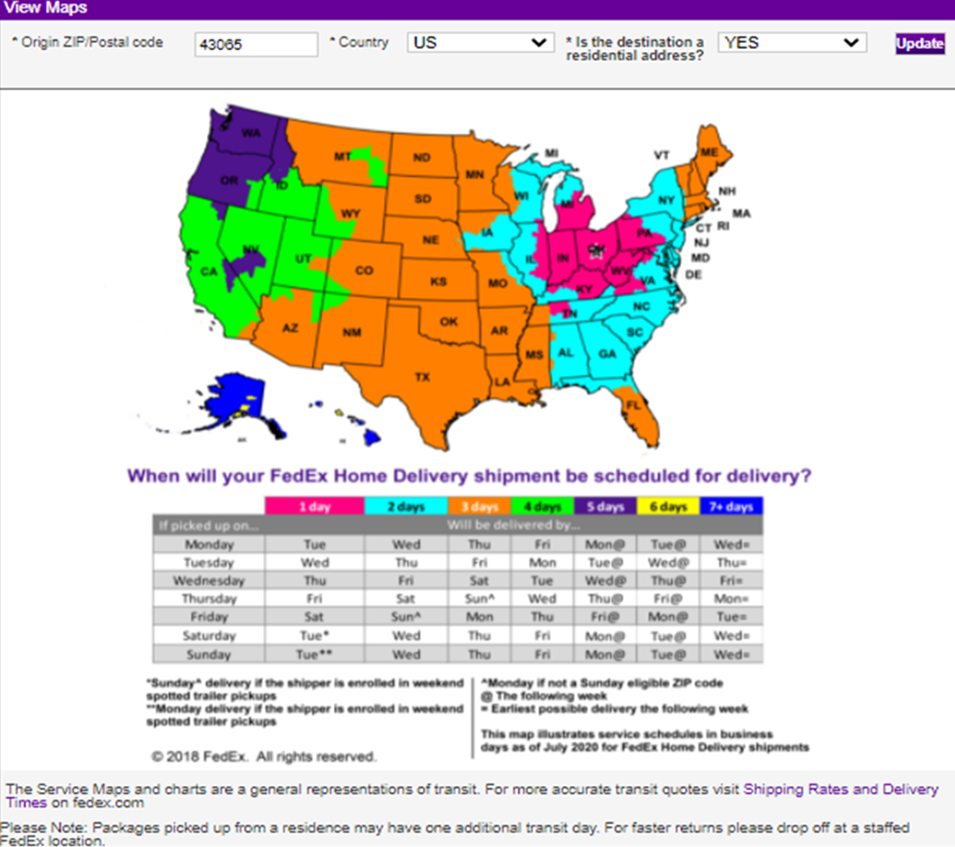
In the basic transit maps above, there are minor differences in expected transit time and how the carriers display high level expectations.
·UPS is somewhat vague using the term “business days”. Technically, there are a few ZIP Codes they will deliver to on a Saturday. A shipper would need more detailed ZIP Code info from UPS to set that expectation. (A whole other article…)
·FDX demonstrates the impact of ship day to delivery day. It’s interesting that FedEx has made it known it is in the process of going to 7-day deliveries but are not yet displaying that in these high-level maps. Like UPS, setting that expectation would require more detailed ZIP Code information from FedEx.
·Both carriers are showing they would reach most of the contiguous US in four days or less. Ship on a Monday – deliver by Friday. From the origin ZIP Code used, UPS appears to have more East Coast coverage in two days or less, with the caveat that a different origin ZIP can change the time-in-transit map to more increased coverage. (Another article…)
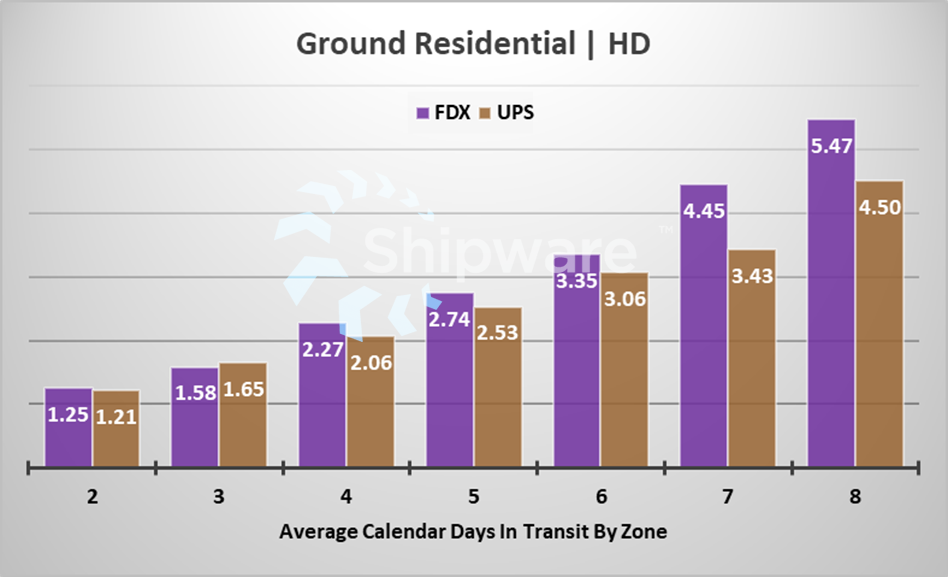
To see how the carriers are performing in relation to the published information, we looked at data using only Monday ship dates from 04/26/21 - 06/14/21. This encompassed seven Mondays and ~4.5 million shipments (does not include Memorial Day). This very recent data illuminates several high-level trends. The calculation is looking at the number of days between the ship date and the delivery date per carrier scan data. The results are in calendars days, which is generally how an e-comm consumer would view it. They want to know when the product will be received, not how many business days it will take.
Chart 3 below shows the average number of transit days by contiguous zone in the Monday ship data (UPS Ground Residential vs FedEx Home Delivery). You can see up to about Zone 5, the average days-in-transit is roughly on par. However, in Zones 7 & 8, UPS is essentially one day faster. Keep in mind this is a snapshot in time, and from experience, there will be times where the competing carrier performs at a higher level.
Chart 3:
Taking a deeper dive, I wanted to see if there were specific states that were skewing the data. Chart 4 below shows the top 3 worst performing FedEx ship-to states in comparison to UPS. Utah clearly had some issues, as even the shorter zones have significant differences in relation to UPS. With a full statistical analysis, a FedEx shipper utilizing similar data could incorporate it into promises of delivery. On the surface, Utah would appear to have a lower confidence level for an accurate delivery date in relation to what is published by zone.
Chart 4:
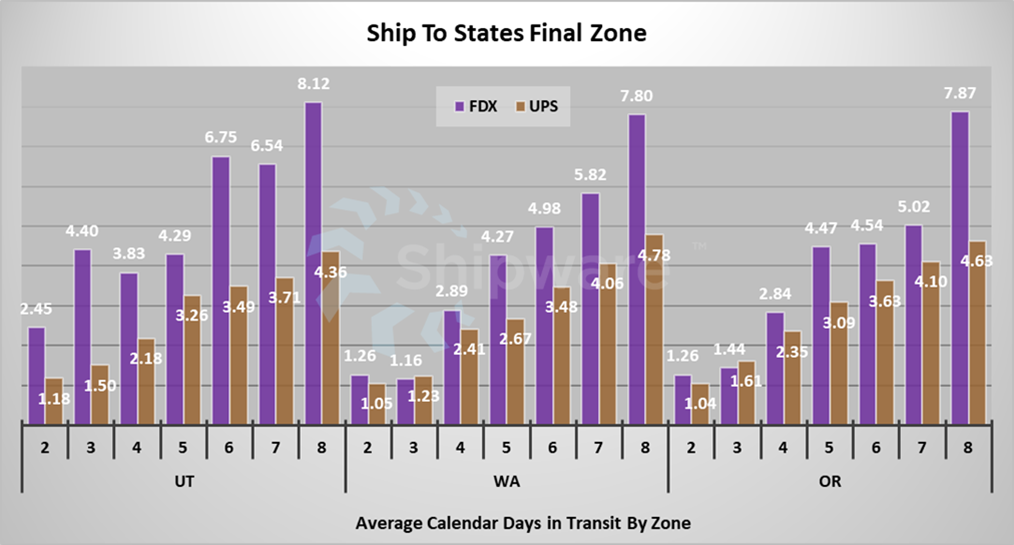
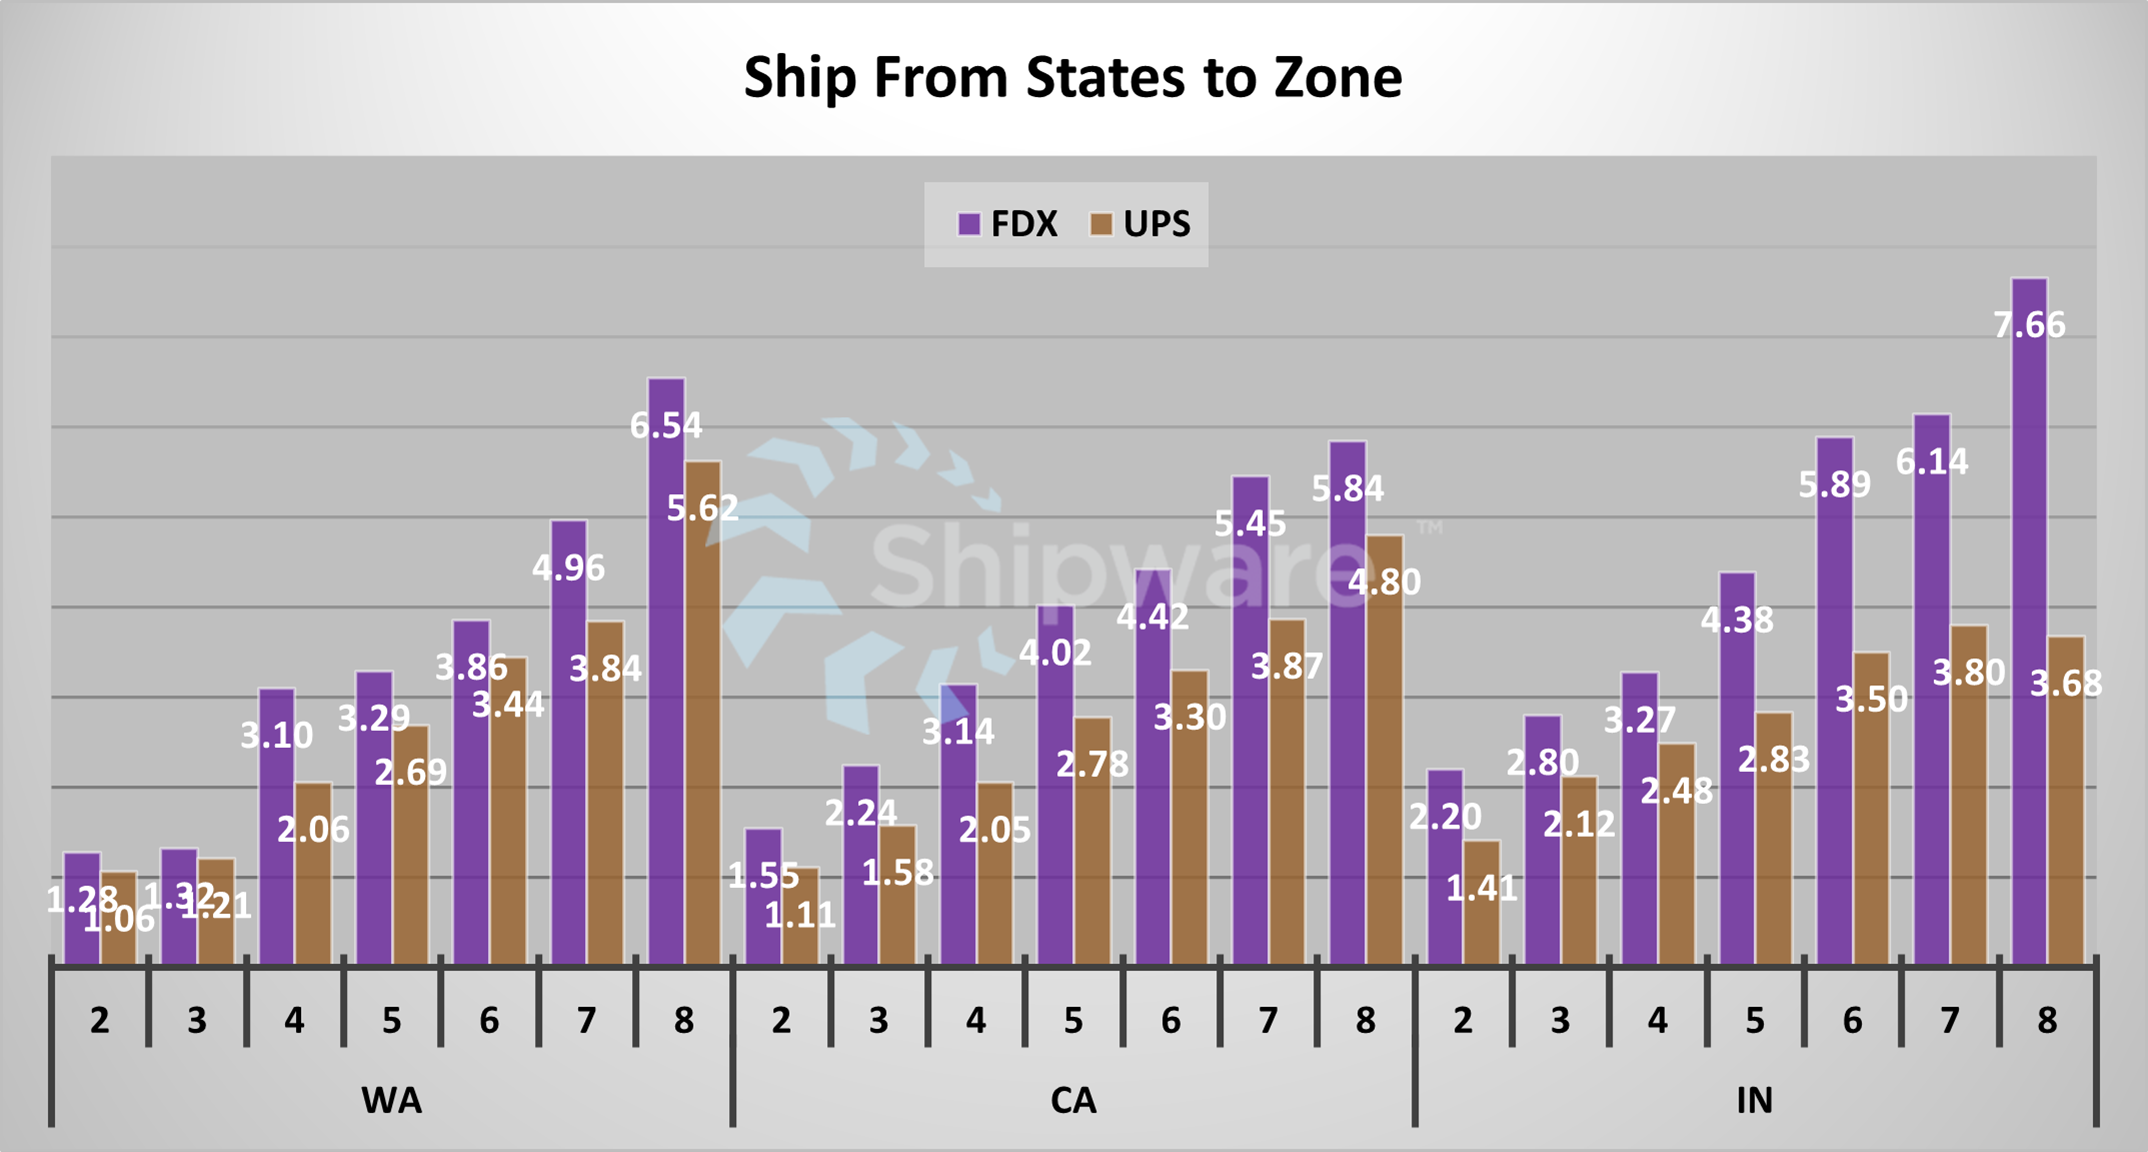
Chart 5 below represents the top 3 worst performing FedEx ship-from states in comparison to UPS. In this case, FedEx shippers in Indiana appear to have to have some transit issues, particularly when shipping to longer zones. Again, similar data with a full statistical analysis can be utilized to influence routing logic, and more accurate delivery promises to a consumer. It is important to emphasize again that these are high-level trends specific to our limited customer data and may not represent national service performance for either carrier.
Chart 5:
What will be interesting to note in the weeks to come is how this data will change as both carriers return to more normal footing. We will certainly be watching the developing trends and guide our clients accordingly. For now, fingers are crossed on the reinstatement of MBG on Ground services.
Karl Wheeler is a Sr. Pricing Consultant with Shipware. Prior to Shipware, Karl was responsible for designing and implementing the entire logistics strategy at autoanything.com, including direct negotiations with carriers. Karl possesses a rare combination of analytical horse-power and strong negotiating skills that has saved Shipware clients millions in transportation spend.